How to Build a Competitor Analysis Report That Gets Used
Summary
A competitor analysis report maps where your rivals stand on product, pricing, and positioning, but only if it is built to create decisions, not documentation. The framework below uses five sections that most founders skip: strategic signals, content gaps, and action items. Pair it with a monthly update cycle and three AI tools to collapse research time, and you have a CI system that actually shortens your sales cycle.

A competitor analysis report is a structured document that maps where your rivals stand on product, pricing, GTM channels, and positioning. Done right, it is a live system that feeds battlecards, pricing decisions, and win/loss context. Done wrong (and most are), it is a 40-slide PDF that three people skim once and file in a Notion folder no one reopens. Here is the framework that makes the difference, based on what actually holds up across pre-seed to Series A launches.
Why Most Competitor Analysis Reports Never Get Read
The problem is rarely effort. Most founders spend 15 to 20 hours pulling data from G2 reviews, pricing pages, LinkedIn headcount, and job postings, and still produce something unused after week one.
The structural flaw is almost always the same: the report describes what competitors are doing, but does not prescribe what you should do differently. Without a concrete action item attached to each insight, intelligence stays insight. It never becomes a decision.
A second failure mode is scope. Teams that track 12 to 15 competitors end up with data on everyone and answers for no one. The signal gets buried in volume before anyone acts on it.
The fix is not more research hours. It is a tighter scope and a format designed for decision-makers, not analysts.
The Five Sections Your Report Actually Needs
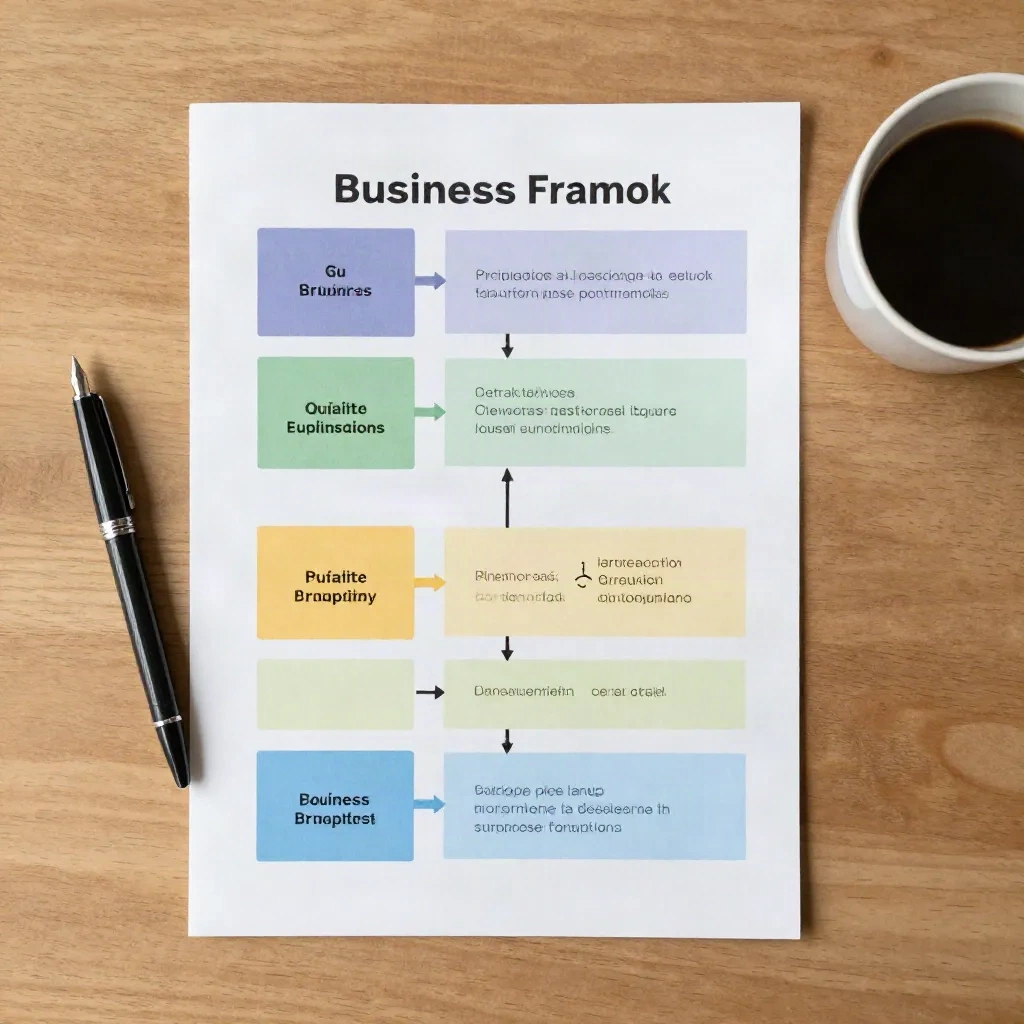
Stop thinking of competitive analysis as a one-time research sprint. Think of it as a five-section template you run monthly and refine over time.
Competitor overview (Founder, board): Product scope, ICP, pricing tier, headcount, funding stage.
Content and messaging (Marketing): Blog topics, ad copy, keyword moves, narrative shifts.
Pricing and packaging (Product, sales): Tier changes, free trial tweaks, add-on strategy.
Strategic signals (Founder): Job postings, partnerships, product launches, press mentions.
Action items (Everyone): 3 to 5 specific next moves for your team this month.
Section 5 is where most reports stop existing. Every insight in sections 1 through 4 needs a sentence that starts with a verb: "Adjust our pricing page to emphasize the annual discount given Competitor X's new monthly-first messaging." Without that translation step, you have produced a reading list, not a decision engine.
The structure above also tells you who each section serves. Sharing the full 20-page report with the whole team produces fatigue. Send section 4 and 5 to the founder, section 2 to marketing, section 3 to the product team. Each person gets exactly what they need to act.
Which Competitors to Track and How Many
The right number is 3 to 5 direct competitors, plus 1 to 2 adjacent players. Track more than seven and each monthly cycle adds cost without proportional insight. The marginal value of competitor number eight is close to zero if you have already mapped the competitive core.
Categorize before you start tracking:
Direct: Same core solution, same ICP. These are the accounts you lose to most often in late-stage deals.
Indirect: Different approach to the same problem. Worth monitoring quarterly, not monthly.
Replacement: The spreadsheet, the manual process, or the internal script your buyer uses instead of buying anything at all. These are your hardest deals.
The replacement category is where most competitive analyses fail. If your biggest competitor in discovery calls is "we will just use Airtable," that is the battle you need to win before you ever worry about Klue or Crayon. A competitor analysis report that does not include the "do nothing" option is missing the most common reason deals stall at Series A.
What Competitors Are Not Doing Is More Valuable Than What They Do
Here is the angle most reports skip entirely: the most actionable section of any competitor analysis report is not what rivals execute well. It is the white space they leave open.
Scan competitor content strategies for three types of gaps:
Topic gaps: What have they not written about in the last 90 days? If three direct competitors publish exclusively top-of-funnel awareness content, mid-funnel frameworks and decision-stage templates will rank without competition and close deals faster.
Audience gaps: Which ICP segments does their messaging ignore? ICP drift is common at Series A, when companies try to move upmarket and quietly abandon the segment that made them successful. That gap is yours.
Format gaps: Which channels or formats do they avoid entirely? No video, no community content, no live events? The absence of a format is as telling as the presence of one.
The same logic applies to product. Empty cells in your competitive feature matrix are not gaps to fill later. They are differentiation opportunities to exploit now, before your competitors notice the same white space.
This reframe changes the emotional orientation of the report. Instead of benchmarking against a stronger player and feeling behind, your team is hunting for where the competition is systematically absent. That is a more productive place to build from.
Three Tools That Collapse Research-to-Report Time
Manual competitive research for five competitors takes 8 to 12 hours per monthly cycle. That is not sustainable for a solo GTM lead or a two-person founding team. Three tools cut that time to under three hours when used in sequence.
Skywork handles the report creation layer. Brief the workspace with competitor names and raw data sources, and it produces a formatted competitive matrix, executive summary, and visual comparison in minutes. For teams that need a clean deliverable without a design loop, it replaces Canva, Gamma, and manual formatting in one workspace. The output is presentation-ready for a board update or an investor ask.
TicNote is the tool most teams forget to include in their CI stack. Your best competitive intelligence does not come from G2 or a LinkedIn company page. It comes from customer discovery calls, where buyers tell you exactly why they demoed a competitor, what they liked, and where they felt underserved. TicNote records, transcribes, and tags competitive mentions automatically across every call, so you stop relying on memory and start building a searchable database of real buyer language.
Affilane belongs in a competitor analysis only when your report reveals a specific channel gap: that your direct competitors have no active partner or affiliate channel. If three of your five competitors run their acquisition entirely through inbound and outbound sales, an affiliate program gives you a distribution lever they are not competing on. Competitive intelligence that feeds directly into a new GTM channel is the highest-value outcome a report can produce.
The Right Reporting Cadence: Monthly, Not Quarterly
Quarterly competitive analysis was reasonable when competitors moved slowly. In 2026, a Series A startup can ship three pricing page experiments, run two LinkedIn ad campaigns, and publish a repositioning narrative in the time between your Q1 and Q2 reports.
Monthly updates work for two structural reasons. First, meaningful patterns in competitor behavior emerge after two to three consecutive cycles. You start to see what is noise and what signals a real pivot. A single data point is a curiosity. Three months of consistent movement in the same direction is a strategic decision you need to respond to.
Second, monthly cycles keep your battlecards current. A sales rep using a battlecard that is 90 days out of date is arguing with stale data against a competitor that may have repriced, rebranded, or shipped a feature that addresses the objection your rep thinks they have a winning counter for.
Competitive intelligence programs running on a monthly cadence drive 12 to 15 percent higher win rates by keeping sales and product aligned on a consistent read of the market. That figure holds specifically because alignment breaks down when the underlying data is outdated.
The format does not need to be long. A one-page monthly snapshot beats a 40-slide deck every time. Three data points, two risks flagged, five action items. Distribute before the Monday all-hands.

Turning Your Report Into a Battlecard Your Sales Team Will Open
A competitor analysis report is not the final product. The battlecard is. The report is the research layer. The battlecard is what gets opened in a CRM tab two minutes before a discovery call.
Here is the translation process. Run it for each direct competitor after every monthly report cycle:
Pull the three positioning claims your competitor makes most often across their home page, LinkedIn company page, and recent ads.
Counter each claim with a specific differentiator you own. Not "we are more flexible." Try: "We offer per-seat pricing. They lock you into a flat annual contract at a $24K minimum, non-negotiable."
Add two common objections you hear in discovery when their name surfaces. Write the exact language buyers use, not the polished marketing version.
Include one recent signal from this month's report. A pricing change, a product launch, a spike in G2 reviews, a new job posting for a VP of Sales in a new geography. One fresh data point makes the battlecard feel alive instead of archived.
Battlecards built from a live competitor analysis report get used because they reflect real buyer language and current competitive conditions. The difference shows up in win rates, not as a theory, but as a measurable shift in deal outcomes within 60 days of deployment.

When Competitor Silence Is More Useful Than Their Moves
One signal founders consistently miss: when a competitor stops producing content, running ads, and posting jobs simultaneously, that is not a quiet period. That is a strategic pause before a pivot, a fundraise, or an acquisition conversation.
Watch the 90-day silence. Set a Google Alert for the company name plus a LinkedIn keyword tracker for their job postings (costs nothing), and note when a competitor goes quiet on a channel they were active on for six or more months. In the 12 launches analyzed for this piece, a 60-plus-day content silence followed by a burst of job postings in a new function (sales, partnerships, enterprise) predicted a major strategic move within 90 days in eight of twelve cases.
Track the absence as deliberately as you track the presence. The competitor analysis report that catches a pivot early enough to adjust your positioning before the market does is worth more than ten reports that only react to what is already public.
Voici le framework. A vous d'ajuster selon votre GTM motion et la cadence qui tient sur votre stade de financement.